Debug Tools and Methods Summary
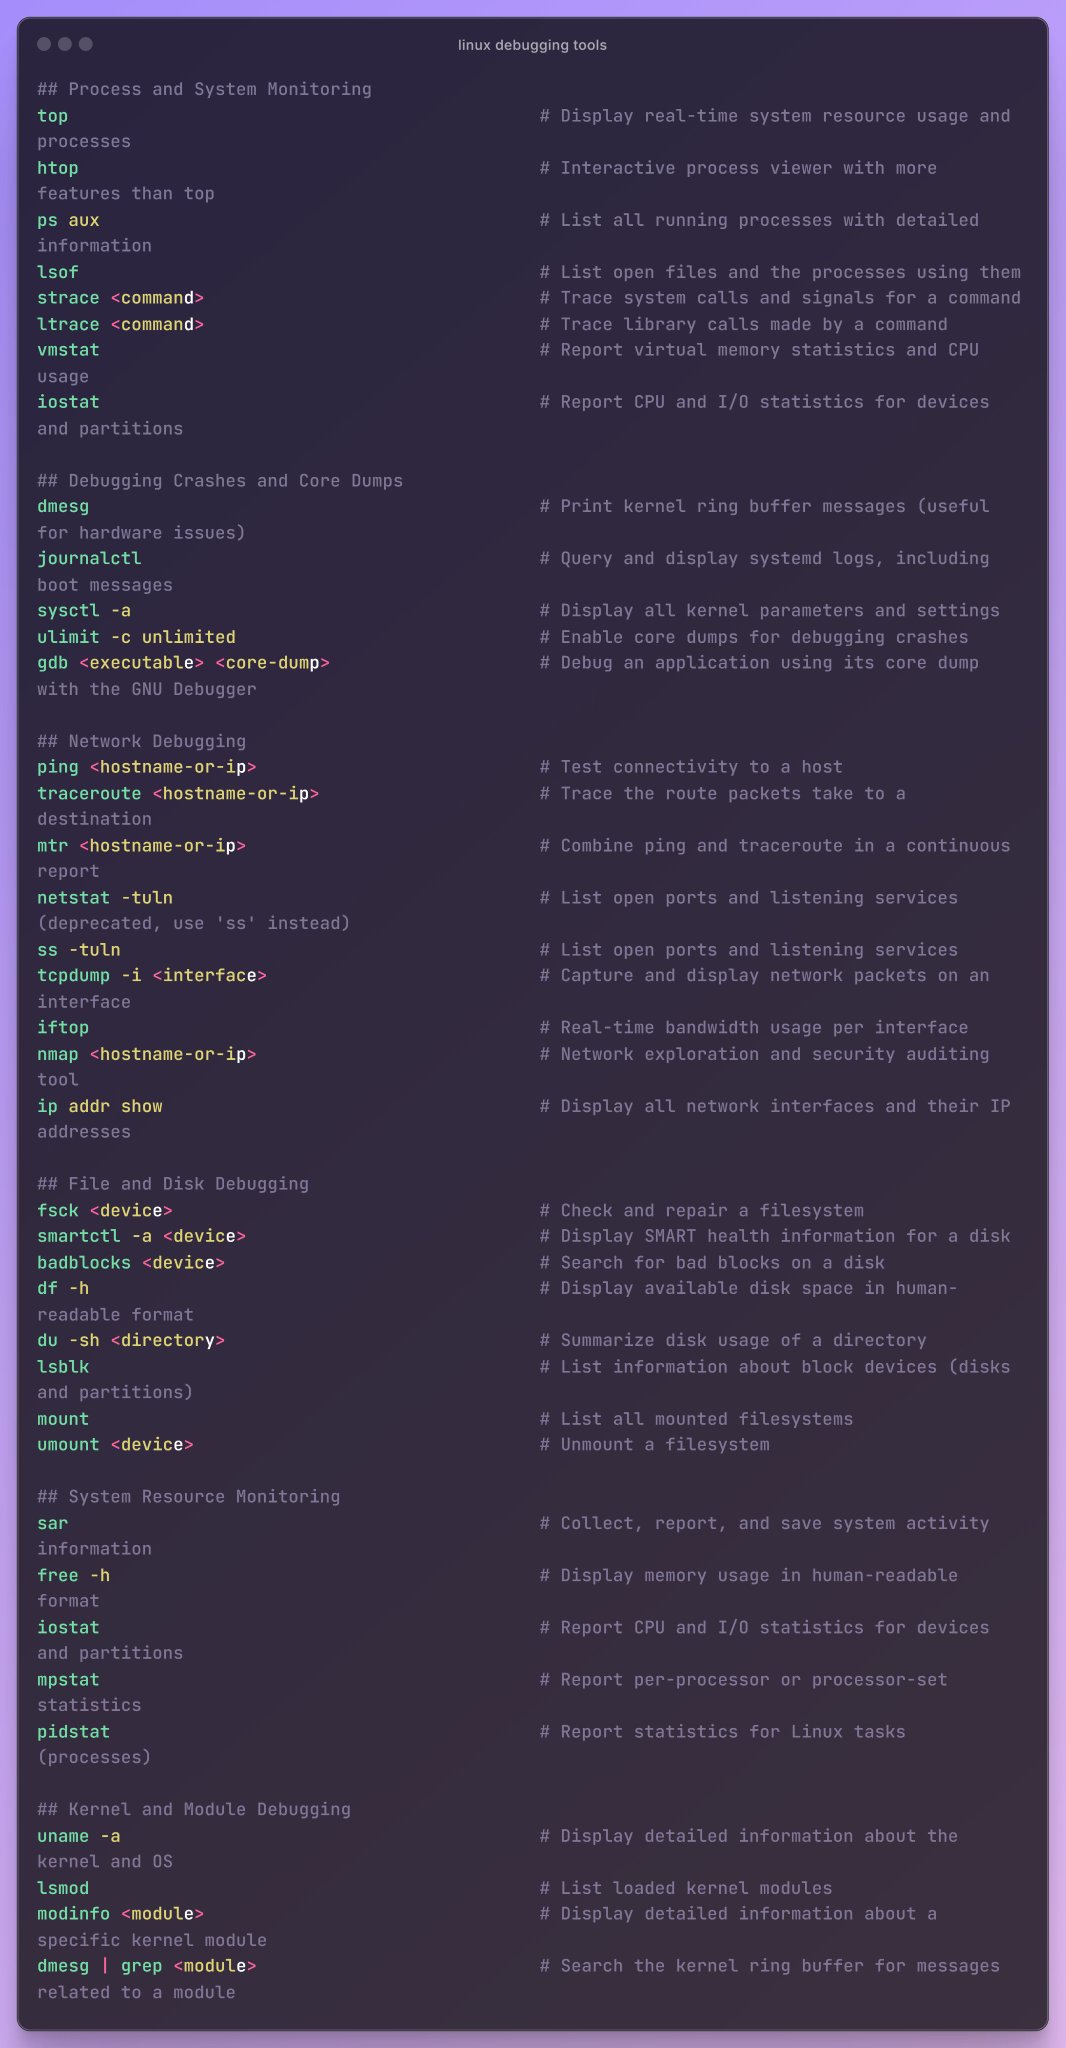
Linux Debug Tools
The USE Method
USE is an acronym for Utilization, Saturation, and Errors. Brendan Gregg suggests using it to get started quickly when you’re diving into an unknown system: “I developed the USE method to teach others how to solve common performance issues quickly, without overlooking important areas. Like an emergency checklist in a flight manual, it is intended to be simple, straightforward, complete, and fast.”
- Utilization: the average time the resource spent servicing work.
- Saturation: the degree to which the resource has extra work that it cannot service, often resulting in a queue.
- Errors: the count of error events.
https://www.brendangregg.com/usemethod.html
The RED Method
The acronym stands for Rate, Errors, and Duration. These are request-scoped, not resource-scoped as the USE method is. Duration is explicitly taken to mean distributions, not averages.
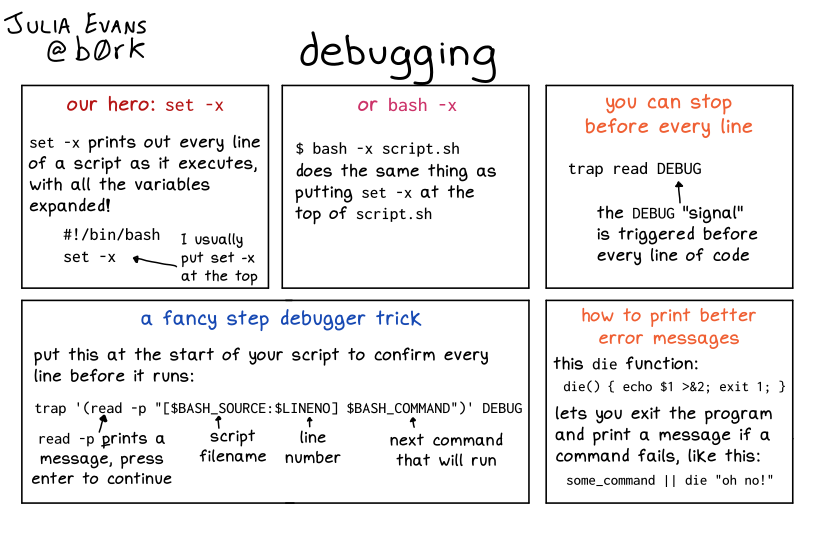
Debug in Bash
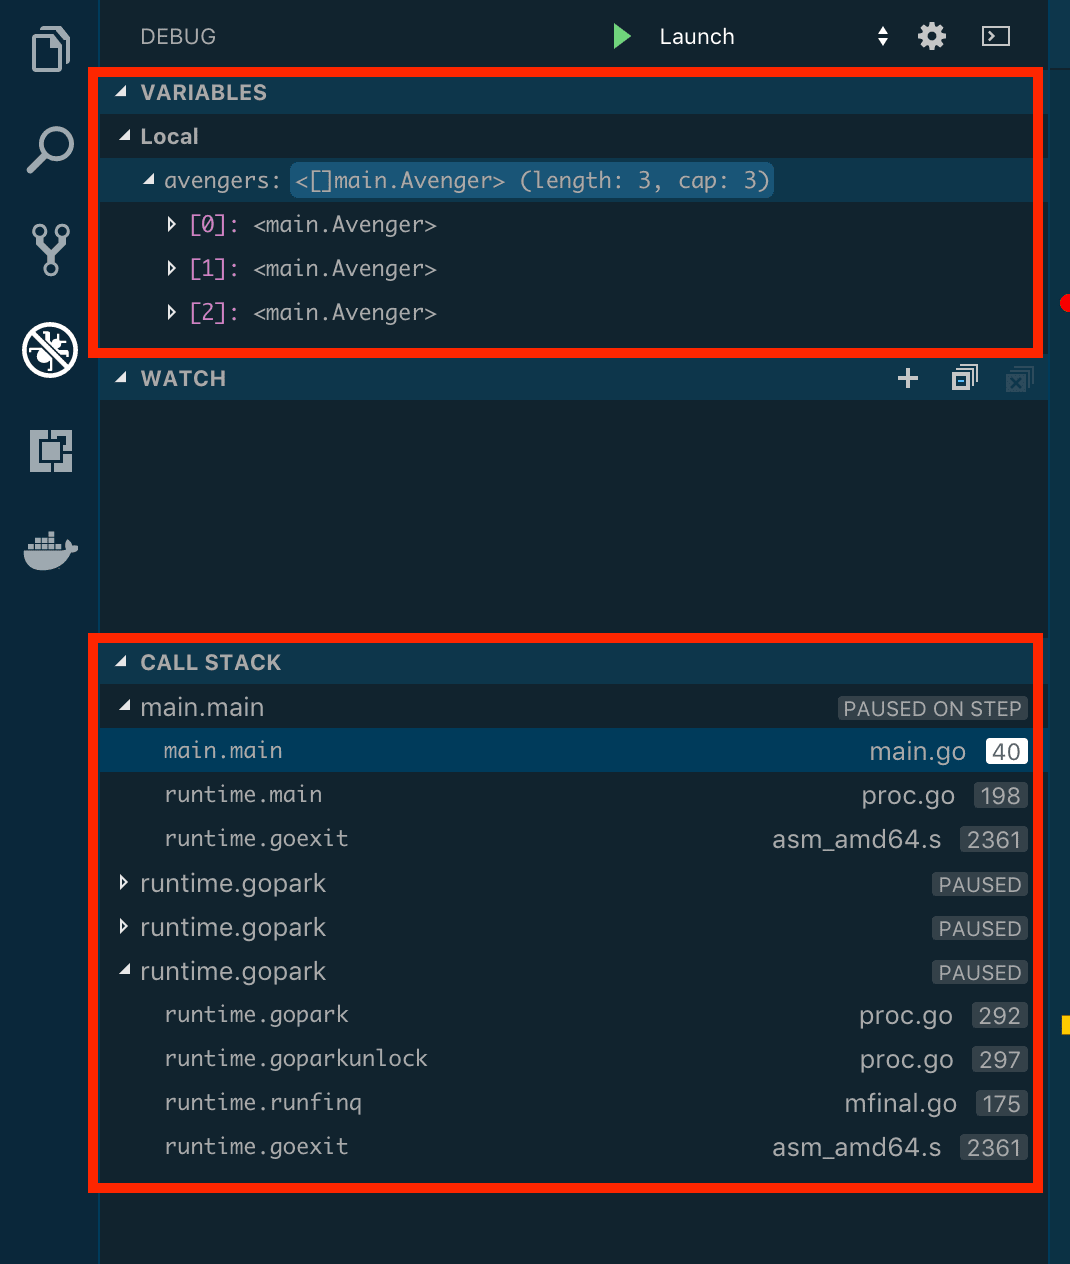
Debug in Golang
Debug in Python
Debug in C

Debug C with Clang compiler & LLDB
Debug in Lua
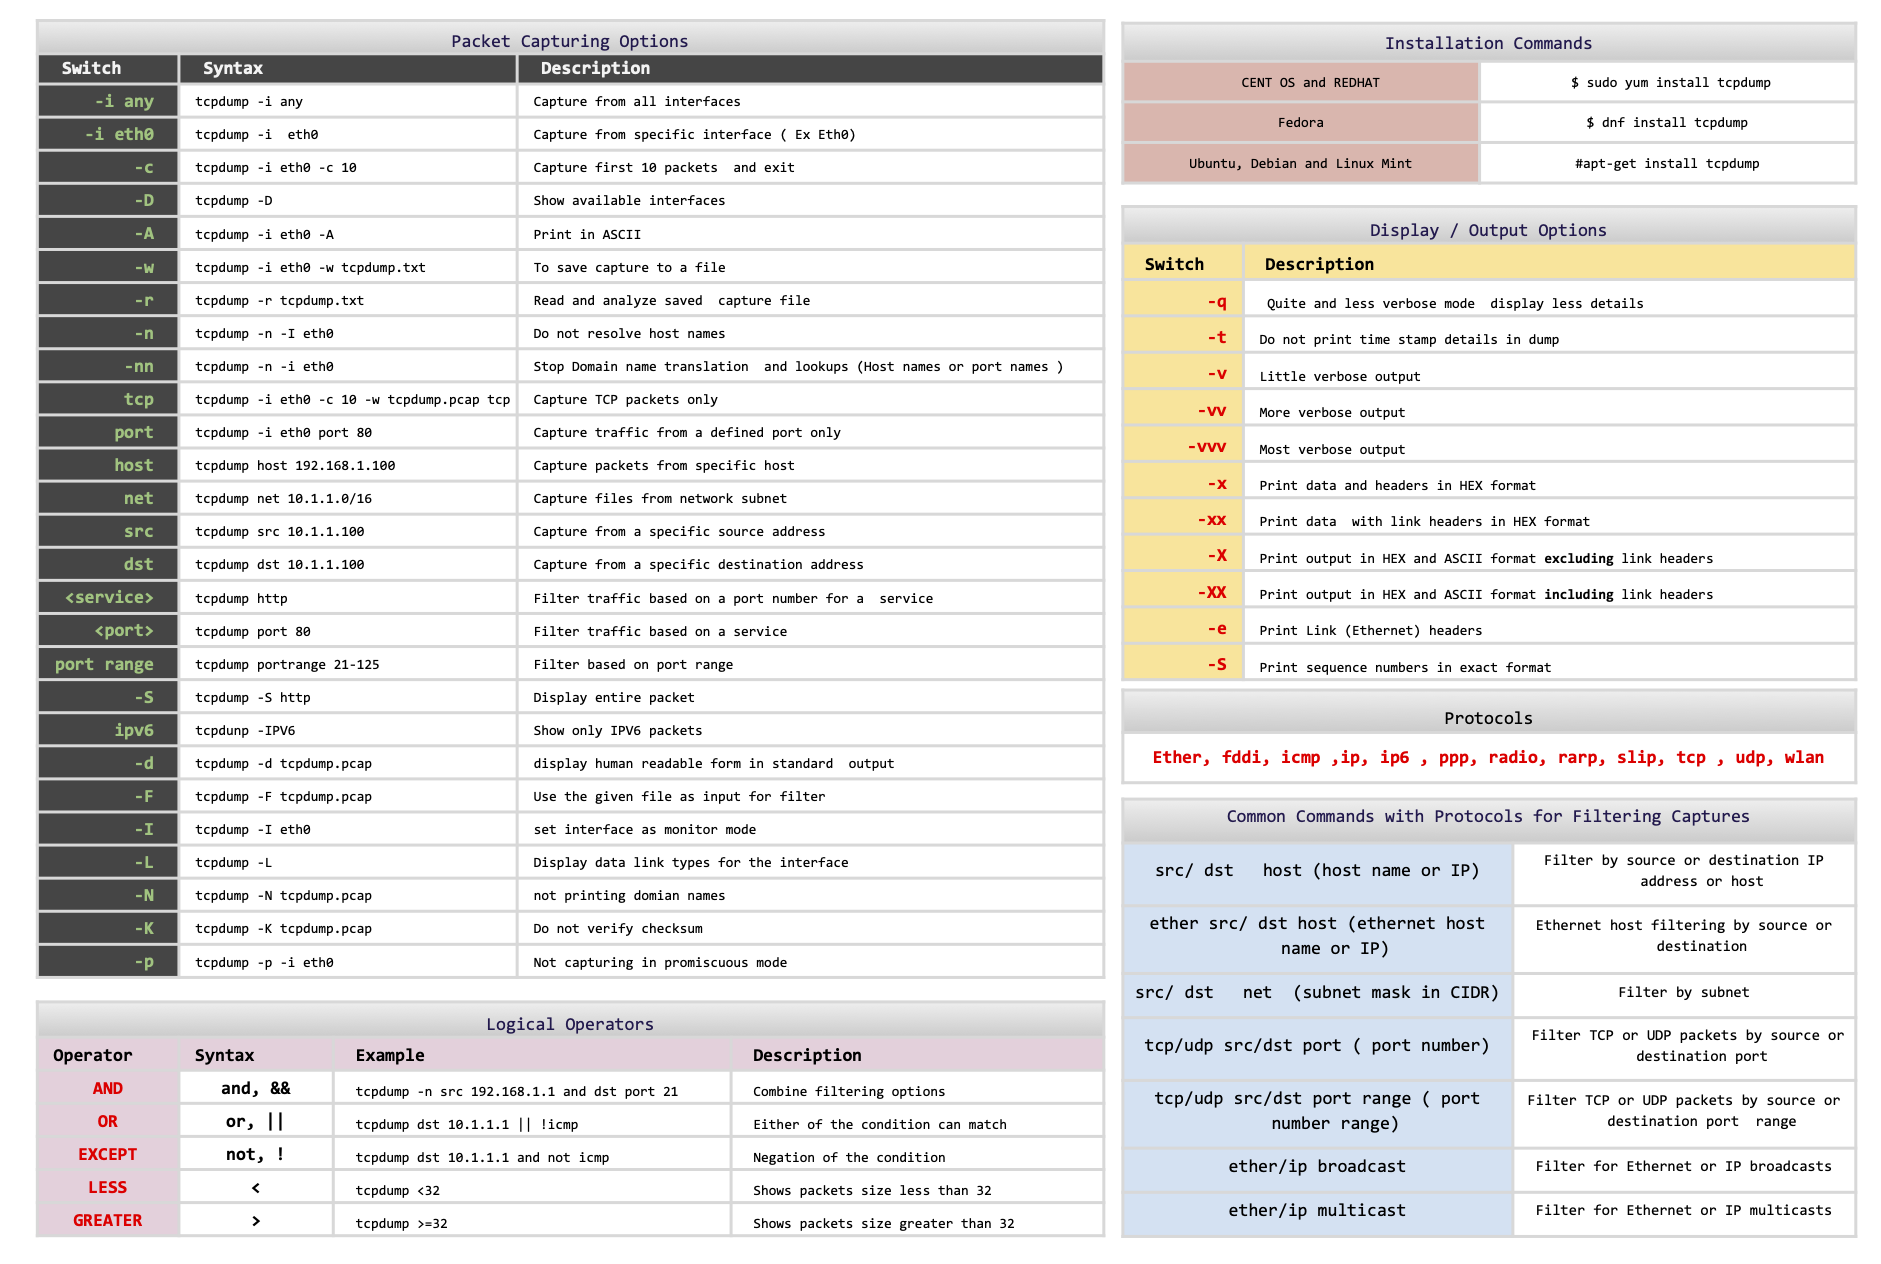
Network debug
Reference
https://go.dev/doc/gdbhttps://www.bugzilla.org/https://www.rookout.com/blog/golang-debugging-tutorial/https://www.digitalocean.com/community/tutorials/debugging-go-code-with-visual-studio-codehttps://www.comparitech.com/net-admin/tcpdump-cheat-sheet/
Some of the content is generated by AI, please be cautious in identifying it.