Debug & Analyzing coredump with gdb

Introduction
Coredump is a file that contains an image of a process’s memory when it crashes. Debugging coredump with gdb is an effective way of finding the root cause of the crash. Gdb is a powerful debugging tool that can help developers to analyze and fix problems in their code. In this blog post, we will discuss how to debug coredump with gdb.
Setting limit
set
coredumpfile size limit
ulimit -c unlimited
Using gdb
gdb /PATH/TO/BIN /PATH/TO/CORE_DUMP
Analyzing the Coredump
Before we start debugging the coredump with gdb, we need to analyze it. Coredump contains a snapshot of the process’s memory when it crashed. We can use the gdb tool to analyze the coredump and find out what happened at the time of the crash. We can load the coredump into gdb using the following command:
gdb <executable file> <coredump file>
Once the coredump is loaded into gdb, we can use the various gdb commands to analyze the memory contents, stack trace, and other details. The following gdb commands are commonly used for analyzing coredump:
bt: Print a backtrace of the stackinfo registers: Display the contents of CPU registersinfo threads: Display the list of threads in the processx/<length><format> <address>: Examine memory at a specified address using the specified format and length
Debugging the Coredump
Once we have analyzed the coredump and identified the root cause of the crash, we can start debugging it. We can use the gdb commands to set breakpoints, run the program, and step through the code. The following gdb commands are commonly used for debugging coredump:
break <function name>: Set a breakpoint at the specified functionrun: Start the program and run until a breakpoint or error occursnext: Execute the next line of codestep: Execute the next line of code, stepping into function callscontinue: Continue running the program until the next breakpoint or error occurs
By using these gdb commands, we can step through the code and identify the root cause of the crash. We can also modify the variables, call functions, and change the flow of the program to test different scenarios.
Conclusion
Debugging coredump with gdb is an essential skill for developers. By analyzing and debugging coredump, we can find the root cause of the crash and fix it. Gdb is a powerful tool that can help us to analyze and debug the coredump effectively. By using the gdb commands, we can step through the code, modify variables, and test different scenarios to find the root cause of the problem.
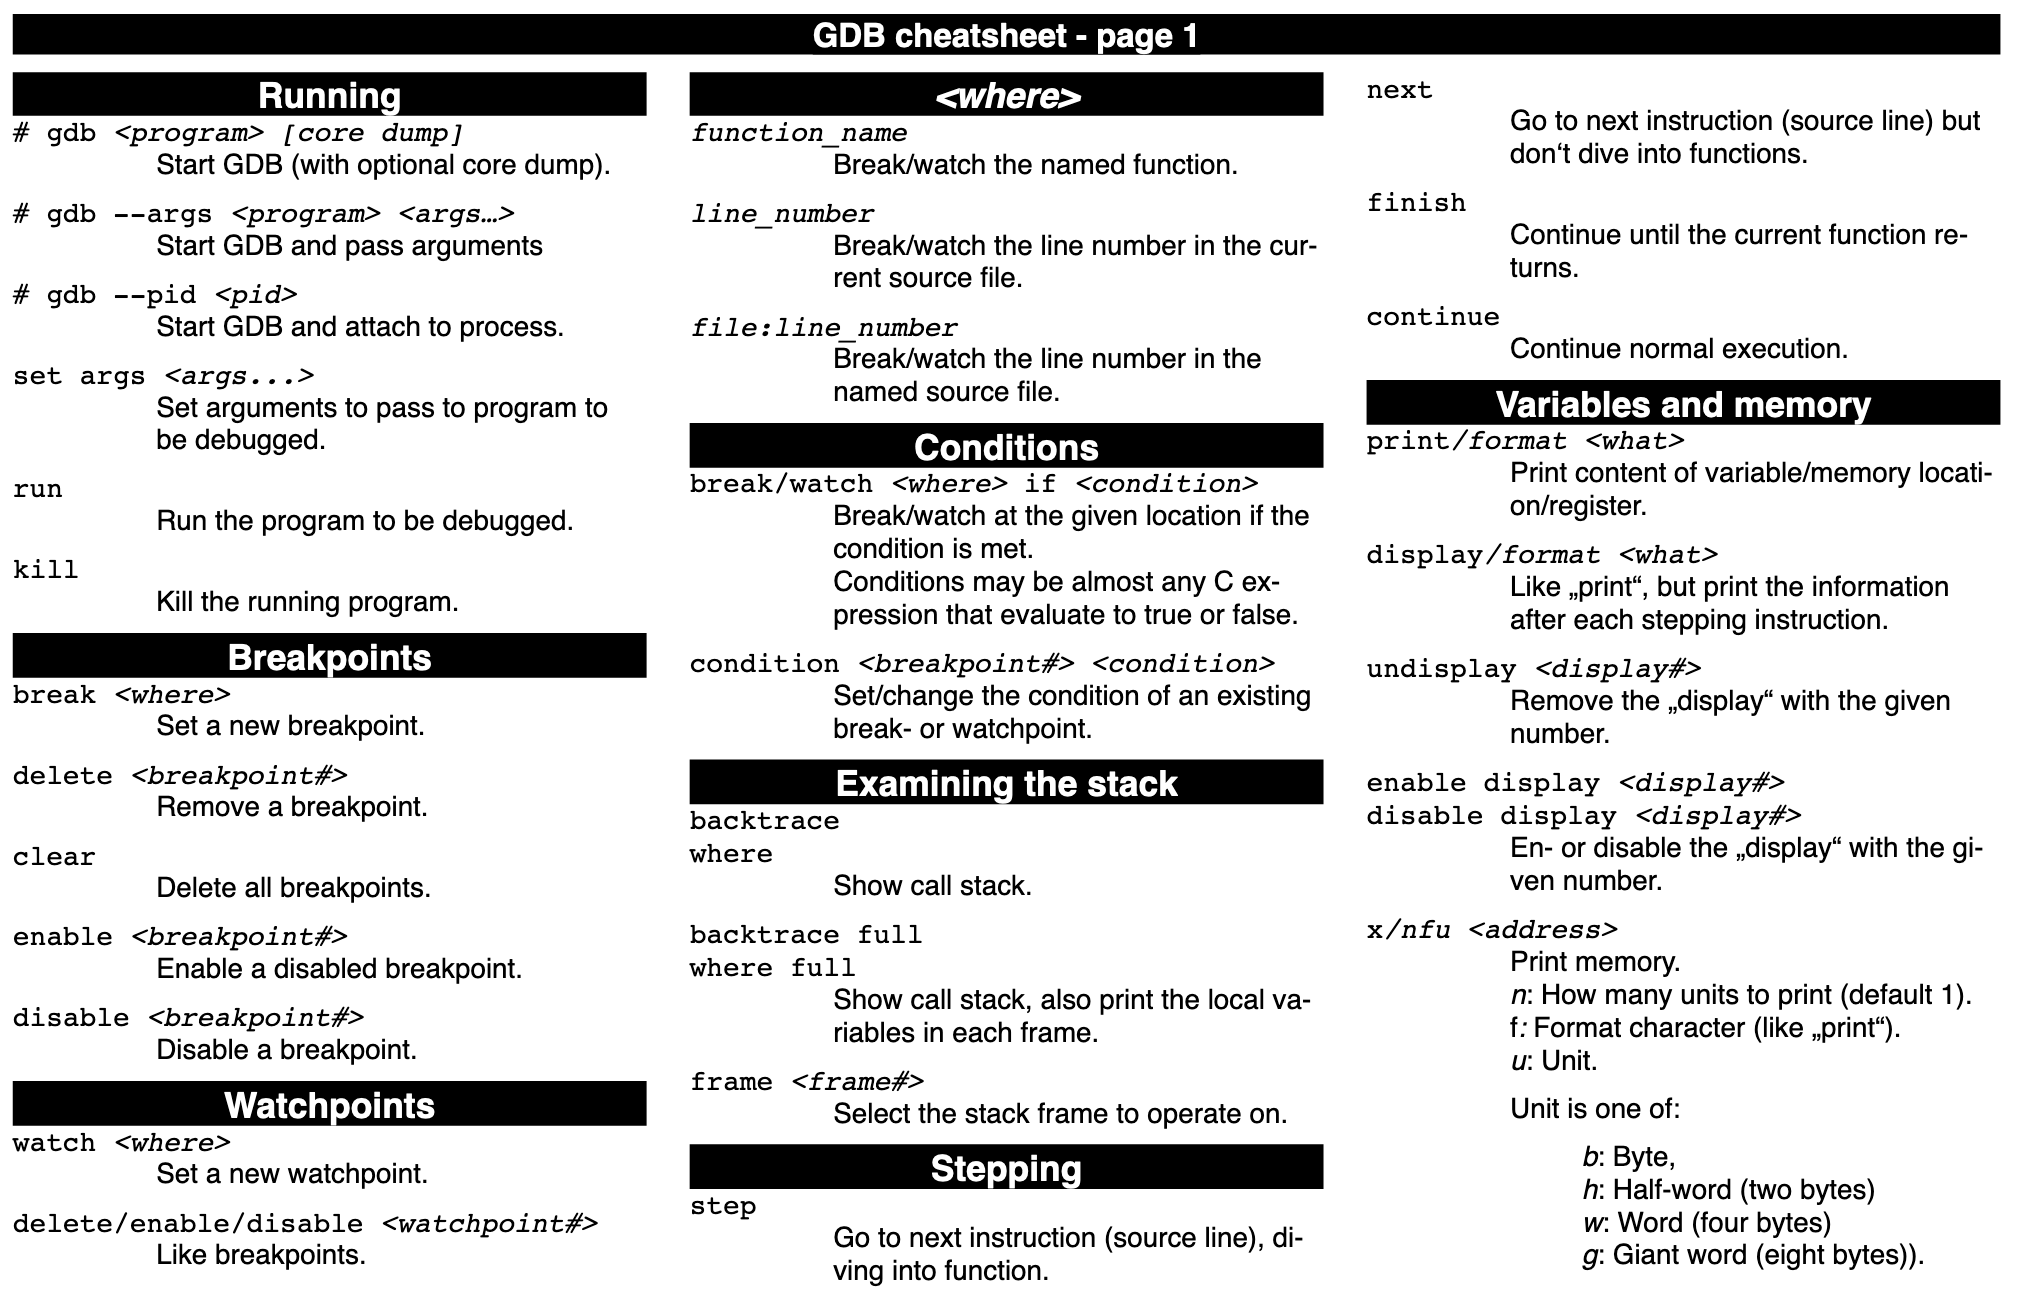
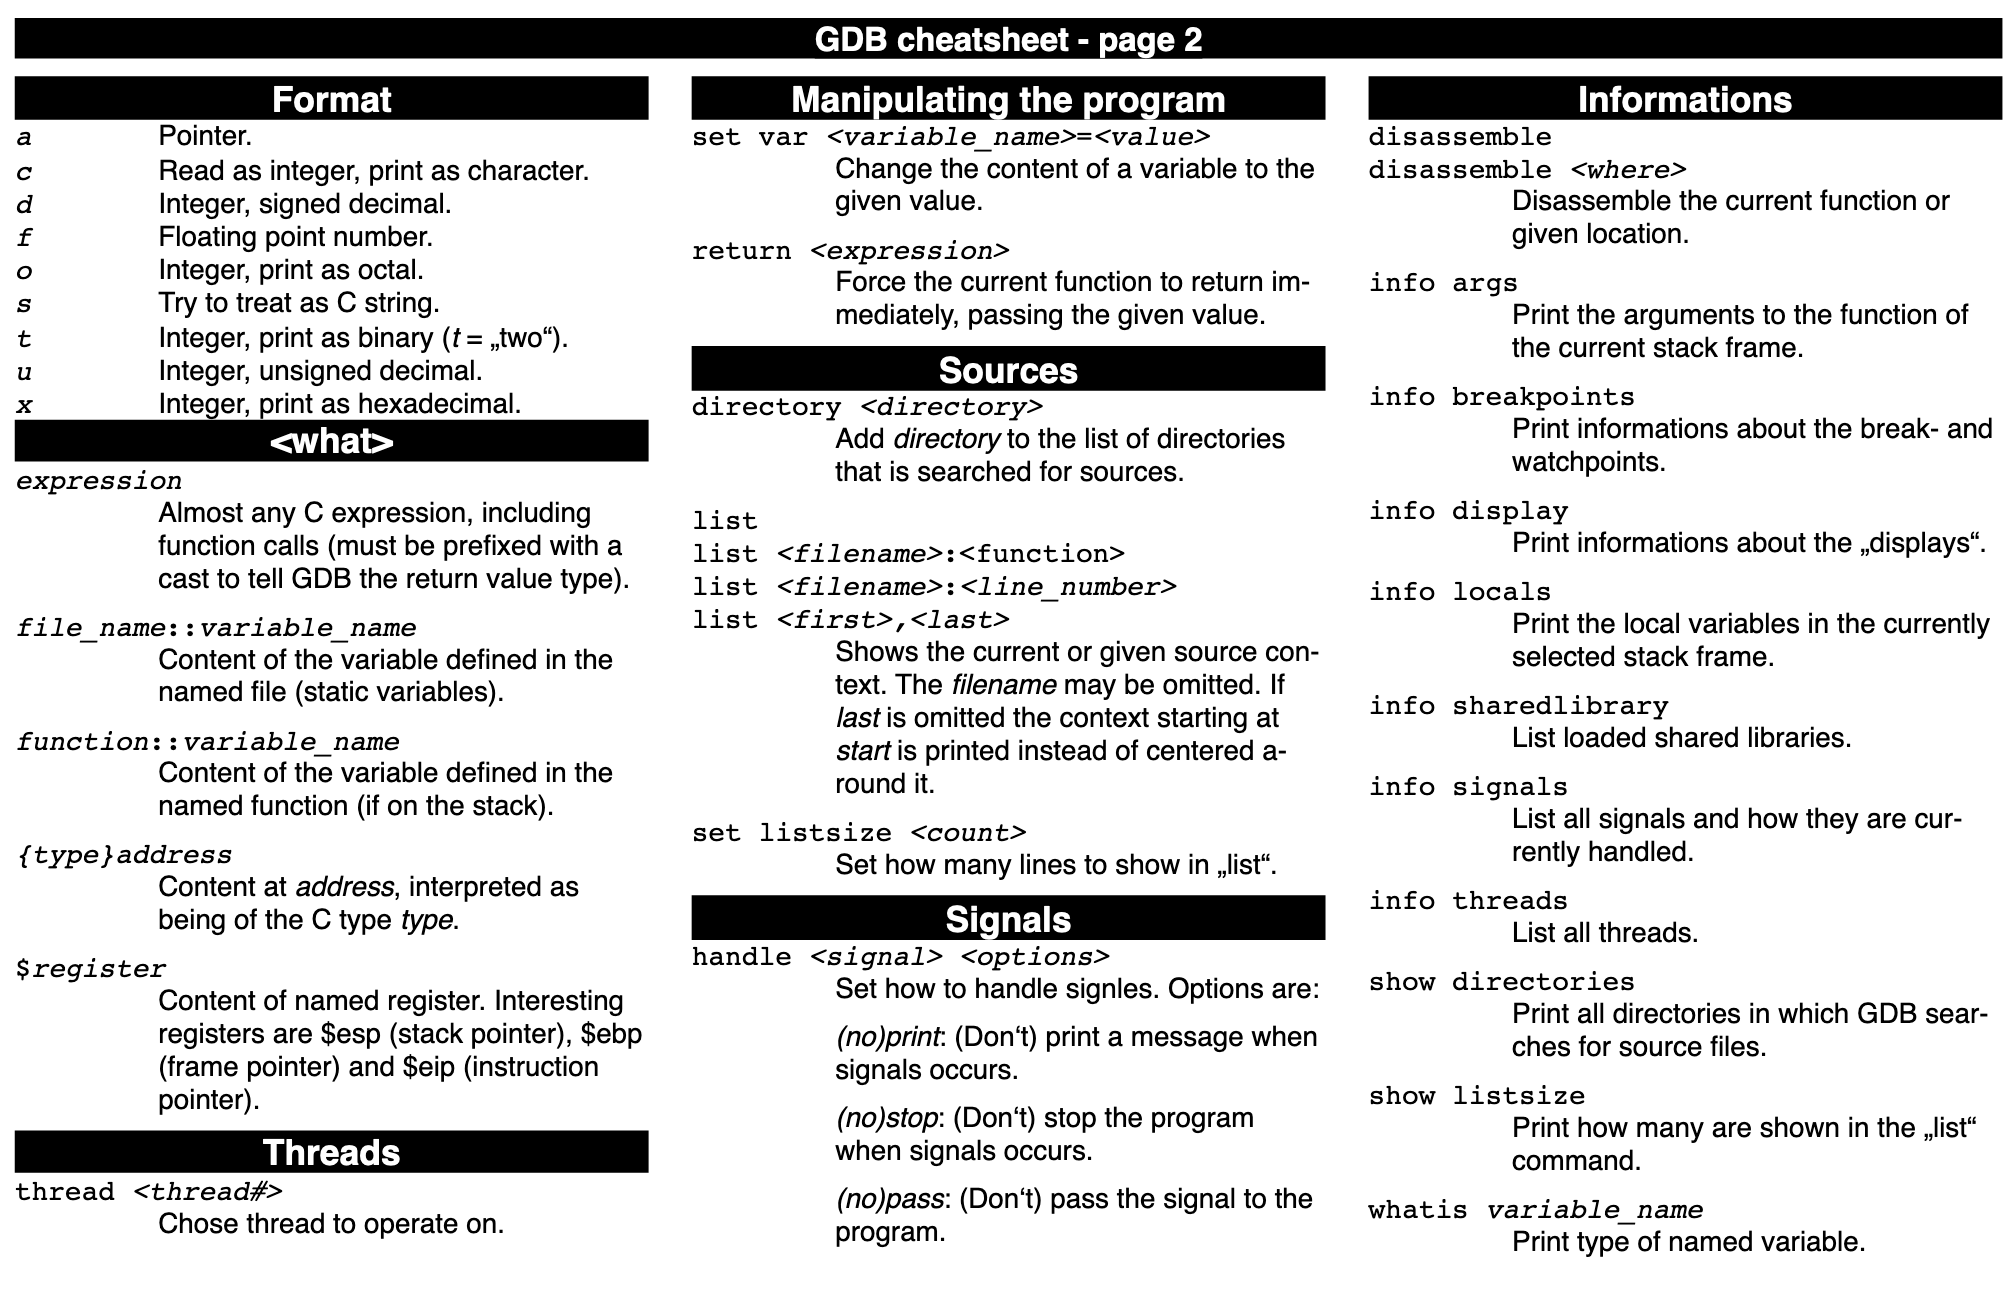
cheatsheet
Reference
https://www.recurse.com/blog/5-learning-c-with-gdb