Troubleshooting K8s Issues from 9 aspects
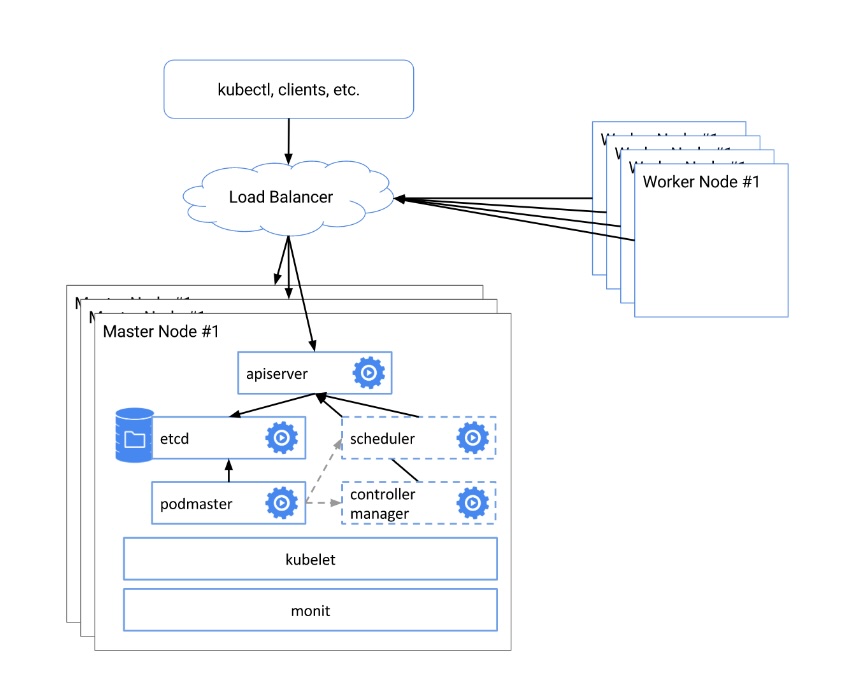
Table of Contents
- Abnormal POD startup, some nodes unable to start pods
- Examine cluster status
- Track event logs
- Focus on Pod status
- Check network connectivity
- Review storage configuration
- Investigate container logs
- K8S cluster network communication
- Issue: Is the Service working through DNS?
- Summary
1. POD startup exception, some nodes cannot start pods
Managing applications in containers:
- A pod is the smallest scheduling unit in Kubernetes (k8s), and the containers inside a pod share the pod’s space, resources, network, and storage.
- A pod manages a single container.
- A pod can manage multiple containers.
Reasons for pod exceptions:
- Resource overload: When a large number of pods are scheduled on the same physical node, excessive resource usage can cause the physical node to crash.
- Excessive memory and CPU usage: If the application inside the pod has a memory leak, the memory usage of the pod increases rapidly, causing the pod to be killed and affecting the normal operation of the node. (Solution: Perform load testing to determine the memory and CPU usage, and set resource limits accordingly.)
- Network issues: This can cause pods to be unable to communicate. (Solution: Check the status of the Calico network plugin.)
- Storage issues: If the shared storage mounted by the pod cannot be accessed, the pod startup may fail. (Solution: Check if the shared storage is functioning properly and if the storage volume is normal.)
- Code issues: Application code fails after container startup. (Solution: Investigate the application code.)
- Configuration issues: Incorrect resource manifest while deploying deployments and statefulsets can prevent pods from being created. (Solution: Check the resource configuration manifest.)
- Use a monitoring system to troubleshoot the above problems.
2. Examine cluster status
The cluster status in Kubernetes is a crucial starting point for troubleshooting. Use the kubectl get nodes command to check the node status. If any nodes are not ready or in an abnormal state, it may cause application failures. Ensure that essential components such as etcd, kubelet, and kube-proxy are running properly.
3. Tracking Event Logs
Understanding the events happening in a cluster is an important step in troubleshooting K8S issues. Use the kubectl get events command to view the event logs. The event logs contain information related to important events and errors in the cluster. By inspecting the event logs, you can identify potential faults in K8S components or applications and accurately pinpoint the problems.
4. Focus on Pod Status
Run the kubectl get pods --all-namespaces command to retrieve the status of all pods in the cluster. If any pod is not in a running state (e.g., pending, error, or not ready), it is likely related to container or application issues. Use the kubectl describe pod command to obtain detailed information about a specific pod for further investigation.
5. Check Network Connectivity
Ensure that the network connection is functioning properly. Review the network communication between services, pods, and nodes for any issues. Run the kubectl get services command to check the status of services and use kubectl describe service to obtain detailed information about specific services. Additionally, verify the correct configuration of network policies and firewall rules.
6. Review Storage Configuration
If your application uses persistent storage (such as Persistent Volumes and Storage Classes), make sure to check that the storage configuration is correct. Review the storage volume claims, storage classes, and persistent volumes. Use the kubectl get pv, kubectl get pvc, and kubectl get storageclass commands to gather information related to storage.
7. Investigate Container Logs
Examining the logs of containers can provide important clues about application failures. Use the kubectl logs command to view the log output of specific containers within a Pod. If a Pod contains multiple containers, you can use kubectl logs -c to view the logs of a specific container.
8. K8S Cluster Network Communication
The K8S cluster has its own separate internal network, and communication within the cluster relies on network plugins. Common network plugins include Calico, Flannel, Canal, and others.
- The Calico network plugin supports IP address allocation and network policy adjustment, and its performance is on par with Flannel.
- The Flannel network plugin only supports IP address allocation.
- Canal is a combination of the Calico and Flannel network plugins.
The network communication within a K8S cluster includes the following:
- Communication between multiple containers within the same Pod.
- Communication between Pods.
- Communication between Pods and Services.
- Communication between Service resources and the external cluster.
9. Question: Does the Service work through DNS?
Running from a Pod in the same Namespace:
u@pod$ nslookup hostnames

Address 1: 10.0.0.10 kube-dns.kube-system.svc.cluster.local
Name:      hostnames
Address 1: 10.0.1.175 hostnames.default.svc.cluster.local
If it fails, your Pod and Service may be in different Namespaces. Please try using the qualified Namespace name:
u@pod$ nslookup hostnames.default
Address 1: 10.0.0.10 kube-dns.kube-system.svc.cluster.local
Name:      hostnames.default
Address 1: 10.0.1.175 hostnames.default.svc.cluster.local
If successful, you need to adjust your application to access the service using the cross-Namespace name or run the application and Service in the same Namespace. If it still fails, try a fully qualified name:
u@pod$ nslookup hostnames.default.svc.cluster.local

Address 1: 10.0.0.10 kube-dns.kube-system.svc.cluster.local
Name:      hostnames.default.svc.cluster.local
Address 1: 10.0.1.175 hostnames.default.svc.cluster.local
Note the suffix here: “default.svc.cluster.local”. “default” is the Namespace we are working on. “svc” indicates that it is a Service. “cluster.local” is your cluster domain, which may vary in your own cluster.
You can also try this operation on a Node in the cluster:
Note: 10.0.0.10 is my DNS Service, yours may be different)
u@node$ nslookup hostnames.default.svc.cluster.local

10.0.0.10
Server:         10.0.0.10
Address:        10.0.0.10
#53Name:   hostnames.default.svc.cluster.localAddress: 10.0.1.175
If you can find it using a fully qualified name but not a relative name, you need to check if the /etc/resolv.conf file is correct.
u@pod$ cat /etc/resolv.confnameserver

10.0.0.10
search default.svc.cluster.local svc.cluster.local cluster.local example.comoptions ndots:5
The nameserver line must indicate the DNS Service of your cluster, which is passed to kubelet through the –cluster-dns flag.
The search line must include an appropriate suffix to search for Service names. In this example, it searches for services in the local Namespace (default.svc.cluster.local), all Namespaces (svc.cluster.local), and the cluster (cluster.local). Depending on your installation, there may be additional records (up to 6). The cluster suffix is passed to kubelet through the –cluster-domain flag. In this document, we assume it is “cluster.local”, but yours may be different, in which case you should change it in all the commands above.
The options line must set a high enough value for ndots for the DNS client library to consider the search path. By default, Kubernetes sets this value to 5, which is high enough to cover all the DNS names it generates.
10. Summary
Of course, the specific troubleshooting methods depend on your cluster configuration, application deployment, and the specific symptoms of the failure. Depending on the situation, further investigation or other troubleshooting measures may be necessary. By focusing on these directions, you will be better able to resolve K8S failures and ensure the continuous and stable operation of your applications.
Reference
https://dbaplus.cn/news-72-5709-1.html