Observability
Logs
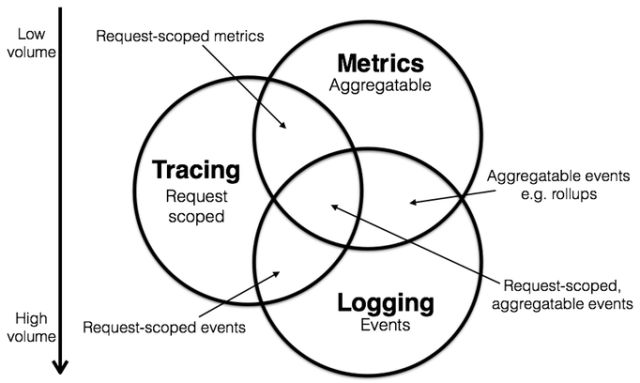
Logs are records of events that have occurred within a system. They can include information about errors, warnings, and other important events that may indicate a problem with the system. By analyzing logs, engineers can identify patterns and correlations that can help them understand the underlying causes of issues.
Logs are detailed, timestamped textual records of events, typically recorded in plain text, binary or structured formats. They often provide a starting point for engineers seeking to understand and diagnose system issues.
Logging functions within SRE observability tools collect, store, analyze and correlate a range of data (including error messages, startup and shutdown processes and configuration changes). They enable SRE teams to understand events chronologically and contextually, making it easier for them to trace the root cause of issues and deploy resolution workflows.
Metrics
Metrics are numerical measurements of a system’s performance and behavior. They can include things like response times, throughput, and resource utilization. By collecting and analyzing metrics, engineers can identify trends and patterns that can help them understand how the system is behaving over time.
Metrics are raw, derived or aggregated quantitative measurements that speak to system health and performance (of a server or an API, for instance) over specific intervals of time. They help organizations build a solid foundation for SRE monitoring and data analysis practices so engineers can identify data patterns and predict systems issues.
Common metrics in SRE include CPU usage, memory consumption, request latency, error rates and network bandwidth, each of which provides a snapshot of the system’s state and helps teams resolve potential issues before they escalate.
Traces
Traces are detailed records of a single request or transaction as it flows through a system. They can include information about the components involved, the data being processed, and the time taken to complete the request. Traces can be particularly useful for understanding the root cause of issues in distributed systems, as they allow engineers to see how a request is being handled as it travels through different components.
Traces, such as HTTP requests and database queries, provide a comprehensive view of a data request’s lifecycle from initiation to completion. They represent the journey of a request through a computing network, capturing the interactions (dependencies, for instance) between different components and services.
Tracing—namely distributed tracing—is valuable in microservices architectures, where requests might traverse multiple services before reaching their destination.
References
- What is Observability? (
https://www.datadoghq.com/blog/observability/) - Observability: The Key to Modern Software (
https://www.datadoghq.com/blog/observability/) - Charity Majors, Liz Fong-Jones, George Miranda - Observability Engineering Achieving Production Excellence (2022)
- Alex Boten - Cloud-Native Observability with OpenTelemetry (2022)
- Alex Pollitt, Manish Sampat - Kubernetes Security and Observability (2021)
https://grafana.com/products/cloud/https://newrelic.comhttps://www.ibm.com/think/topics/sre-observability
Some of the content is generated by AI, please be cautious in identifying it.