System Monitoring
Introduction
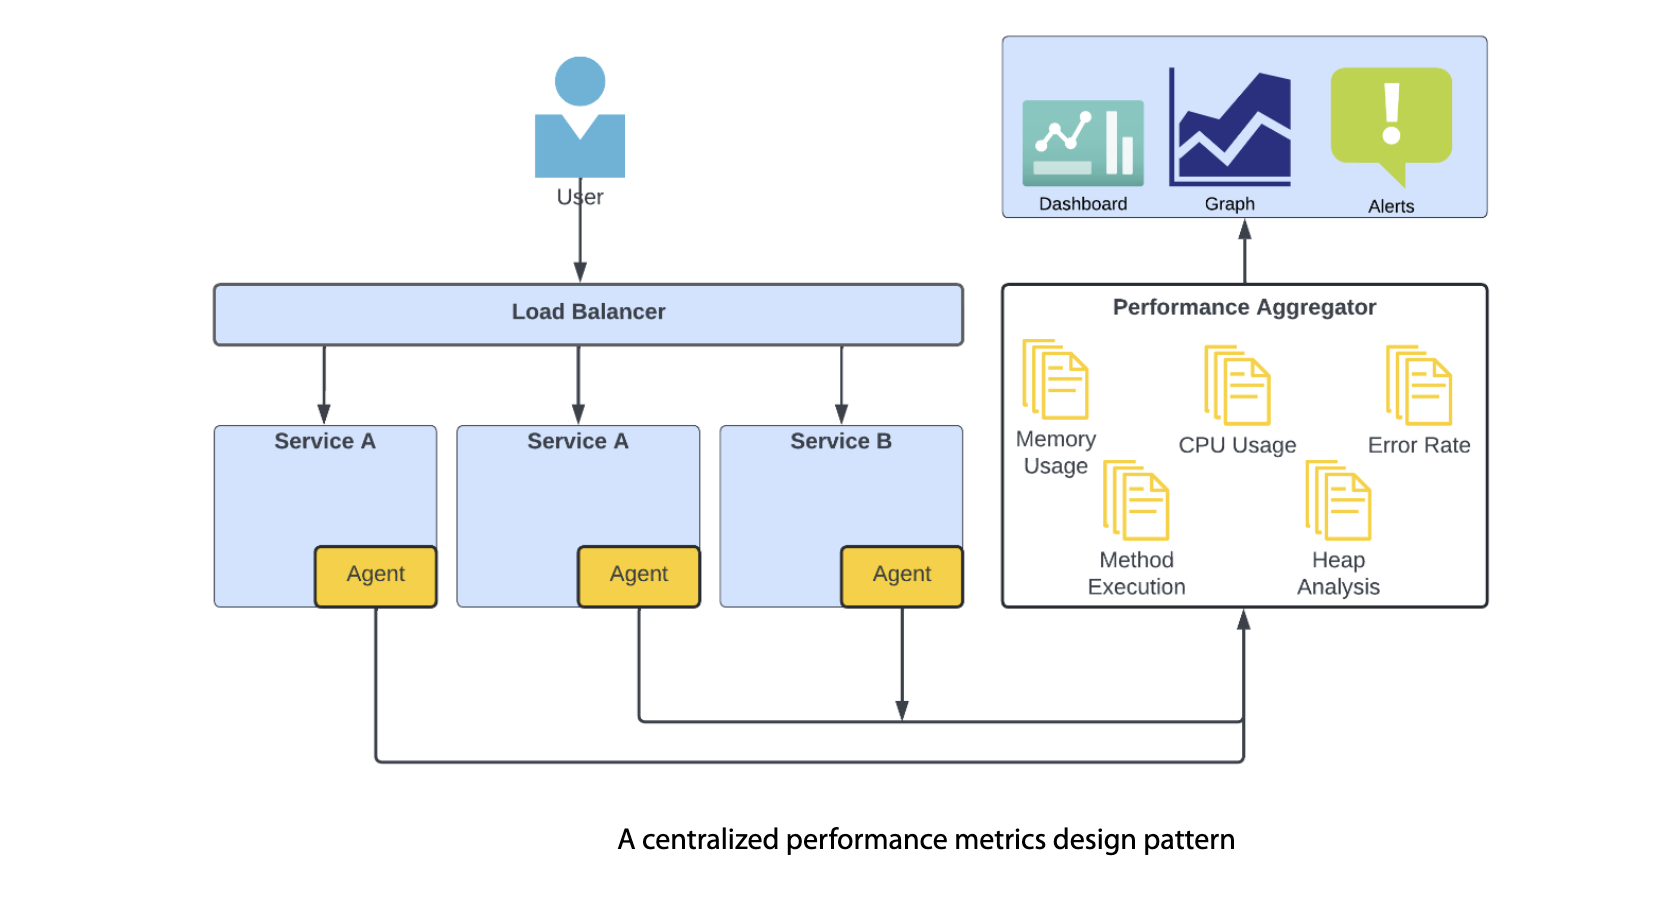
Monitoring is the practice of collecting and analyzing data about the performance and behavior of a computer system or application. It is a critical aspect of maintaining the reliability and availability of any software system. By monitoring a system, one can detect and diagnose issues, identify trends, and optimize performance.
There are several different types of monitoring, including:
- Resource monitoring: This involves collecting data about the system’s resources, such as CPU usage, memory usage, and network bandwidth. This information can be used to identify bottlenecks and optimize performance.
- Performance monitoring: This involves collecting data about the application’s performance, such as response time, throughput, and error rates. This information can be used to identify and diagnose issues and optimize performance.
- Event monitoring: This involves collecting data about specific events that occur within the system, such as system log messages and application log messages. This information can be used to identify and diagnose issues and understand how the system is behaving.
- Availability monitoring: This involves checking the system’s availability by pinging the application or website to ensure that it is up and running. This information can be used to ensure that the system is always available and that any issues are detected and resolved quickly.
When monitoring a system, it’s important to consider the following best practices:
- Use an appropriate monitoring tool: There are many monitoring tools available, such as Prometheus, Nagios, and Zabbix, each with its own strengths and weaknesses. It’s important to choose a tool that is appropriate for your specific needs.
- Collect relevant data: It’s important to collect the right data to understand how the system is behaving. This may include resource usage, performance metrics, and event logs.
- Automate alerting: It’s important to set up automatic alerts so that any issues are detected and resolved as quickly as possible.
- Store and analyze the data: Storing and analyzing the data collected by monitoring tools can help identify trends and patterns that can be used to optimize performance and prevent issues.
- Test and validate the monitoring: It’s important to test and validate the monitoring system to ensure that it’s working as expected and that the data it’s collecting is accurate.
Cloud Monitoring
Cloud monitoring is the practice of collecting and analyzing data about the performance and behavior of cloud-based applications and services. It is a critical aspect of maintaining the reliability and availability of any cloud-based system. By monitoring a cloud-based system, one can detect and diagnose issues, identify trends, and optimize performance.
There are several different types of cloud monitoring, including:
- Resource monitoring: This involves collecting data about the system’s resources, such as CPU usage, memory usage, and network bandwidth. This information can be used to identify bottlenecks and optimize performance.
- Performance monitoring: This involves collecting data about the application’s performance, such as response time, throughput, and error rates. This information can be used to identify and diagnose issues and optimize performance.
- Event monitoring: This involves collecting data about specific events that occur within the system, such as system log messages and application log messages. This information can be used to identify and diagnose issues and understand how the system is behaving.
- Availability monitoring: This involves checking the system’s availability by pinging the application or website to ensure that it is up and running. This information can be used to ensure that the system is always available and that any issues are detected and resolved quickly.
When monitoring a cloud-based system, it’s important to consider the following best practices:
- Use an appropriate monitoring tool: There are many monitoring tools available, such as Prometheus, Nagios, and Zabbix, each with its own strengths and weaknesses. It’s important to choose a tool that is appropriate for your specific needs.
- Collect relevant data: It’s important to collect the right data to understand how the system is behaving. This may include resource usage, performance metrics, and event logs.
- Automate alerting: It’s important to set up automatic alerts so that any issues are detected and resolved as quickly as possible.
- Store and analyze the data: Storing and analyzing the data collected by monitoring tools can help identify trends and patterns that can be used to optimize performance and prevent issues.
- Test and validate the monitoring: It’s important to test and validate the monitoring system to ensure that it’s working as expected and that the data it’s collecting is accurate.
In conclusion, monitoring is a critical aspect of maintaining the reliability and availability of any software system. By collecting and analyzing data about the system’s performance and behavior, one can detect and diagnose issues, identify trends, and optimize performance. Choosing the right monitoring tool, collecting relevant data, automating alerting, storing and analyzing the data and validating the monitoring system are the best practices to follow.
Key Metrics
Cluster health metrics
- Number of nodes
- Node health status
- Number of Pods per node, and overall
- Resource usage/allocation per node, and overall
Deployment metrics
- Number of deployments
- Number of configured replicas per deployment
- Number of unavailable replicas per deployment
Container metrics
- Number of containers/Pods per node, and overall
- Resource usage for each container against its requests/limits
- Liveness/readiness of containers
- Number of container/Pod restarts
- Network in/out traffic and errors for each container
Application metrics
- Number of messages received
- Number of successfully processed messages
- Number of invalid or erroneous messages
- Time to process and act on each message
- Number of successful actions generated
- Number of failed actions
- Requests received
- Errors returned
- Duration (time to handle each request)
Runtime metrics
- Number of processes/threads/goroutines
- Heap and stack usage
- Nonheap memory usage
- Network/I/O buffer pools
- Garbage collector runs and pause durations (for garbage-collected languages)
- File descriptors/network sockets in use
Modern Monitoring System
Prometheus
Prometheus is an open-source toolkit for system monitoring and alerting, utilizing time series metrics data. Its core component is a server that collects and stores metrics. Prometheus also offers optional components like an alerting tool (Alertmanager) and client libraries for programming languages like Go, which can be used to instrument your applications.
Google Stackdriver
Despite originating from Google, Stackdriver isn’t exclusive to Google Cloud as it also functions with AWS. Capable of collecting, graphing, and alerting on metrics and log data from diverse sources, it automatically discovers and monitors your cloud resources. This includes VMs, databases, and Kubernetes clusters. Stackdriver consolidates all this data into a central web console, enabling you to create custom dashboards and alerts.
AWS Cloudwatch
Cloudwatch, Amazon’s own cloud monitoring product, offers a feature set similar to Stackdriver. It integrates with all AWS services, and you can export custom metrics using the Cloudwatch SDK or command-line tool.
Cloudwatch provides a free tier that lets you gather basic metrics, such as CPU utilization for VMs, at five-minute intervals. It also includes a specific number of dashboards and alarms. Additional costs apply for extra metrics, dashboards, or alarms. You can also opt for high-resolution metrics (at one-minute intervals) on a per-instance basis, which incurs additional charges.
Azure Monitor
Azure Monitor is equivalent to Google’s Stackdriver or AWS Cloudwatch. It collects logs and metrics data from all your Azure resources, including Kubernetes clusters, permitting you to visualize and set alerts on it.
Datadog
Compared to built-in tools from cloud providers like Stackdriver and Cloudwatch, Datadog is a sophisticated and robust monitoring and analytics platform. It supports integrations with over 250 platforms and services. This includes services from major cloud providers and widely-used software like Jenkins, Varnish, Puppet, Consul, and MySQL.
More
- Datadog
- falcon
- nightingale (
https://github.com/didi/nightingale) - zabbix
- netdata
- telegraf+influxdb/kapacitor+chronograph
- metricbeat+elasticsearch
- prometheus
- Google Stackdriver
- AWS Cloudwatch
- Azure Monitor
- New Relic
| Monitoring Tools | Features | Stand Alone Feature | Pricing | Free Trial / Demo |
|---|---|---|---|---|
Nagios |
1. Monitoring 2. Alerting 3. Event management 4. Performance visualization | Extensive plugin support for various monitoring needs. | $1,995 – $5,995 | No |
Zabbix |
1 Web tracking 2. Monitoring with SNMP 3. Application tracking 4. Dashboards that can be customized | Unified monitoring for networks, servers, and applications. | Open-source, free | Yes |
Prometheus |
1. Collection of time series data 2. Scraping and storing metrics 3. Metrics scraping and storage 4. System of alerts and notifications | Time-series data collection with powerful querying. | Open-source, free | No |
SolarWinds Server & Application Monitor |
1. Application performance monitoring (APM) 2. Infrastructure Surveillance 3. Analytics and reporting in real time 4. EUM stands for end-user monitoring. | Comprehensive application performance management. | Starts at $2,995 | Yes |
Datadog |
1. Infrastructure Monitoring 2. Application Performance Monitoring (APM) 3. Log Management 4. Real User Monitoring (RUM) 5. Network Performance Monitoring | Real-time monitoring with advanced analytics. | $15 per host/month | Yes |
PRTG Network Monitor |
1. Server and application monitoring 2. Monitoring performance in real-time 3. Real-time performance monitoring 4. Reporting and dashboards | Versatile, customizable sensors for all devices. | Starts at $1,750 | Yes |
New Relic |
1. Application performance monitoring (APM) 2. Infrastructure Surveillance 3. Analytics and reporting in real-time 4. EUM stands for end-user monitoring. | Full-stack observability for applications and infrastructure. | Starts at $99/month | Yes |
Dynatrace |
1. User monitoring in real time 2. User experience tracking 3. Browser tracking 4. Performance metrics tracking | AI-driven automated root cause analysis. | Starts at $69/month | Yes |
ManageEngine |
1. Endpoint administration 2. Patch administration 3. Management of mobile devices 4. Remote access and control | Integrated monitoring and IT management solution. | $945 for 10 servers | Yes |
Cacti |
1. Custom sensor design 2. Virtualization tracking 3. Database surveillance 4. Connection to other systems and tools | All-in-one monitoring with an intuitive interface. | Starts at $1,750 | Yes |
Dashboard
- Granafa
- Graphite
- Zeppelin
- Kibana
Q & A
How to Use the watch Command in Linux for Real-Time Monitoring
https://sysadminxpert.com/watch-command-in-linux/
Reference
- What is Monitoring? (
https://www.datadoghq.com/blog/observability/) - 阿里云运维架构实践秘籍(乔锐杰)
https://www.digitalocean.com/community/tutorials/an-introduction-to-metrics-monitoring-and-alertinghttps://checkmk.com/monitoringhttps://www.splunk.com/en_us/blog/learn/database-monitoring.htmlhttps://prometheus.io/https://cloud.google.com/products/operationshttps://aws.amazon.com/cloudwatch/https://learn.microsoft.com/en-us/azure/azure-monitor/overviewhttps://www.datadoghq.com/https://cybersecuritynews.com/server-monitoring-tools/https://levelup.gitconnected.com/the-idea-of-synthetic-monitoring-6c1e9d1caa07
Some of the content is generated by AI, please be cautious in identifying it.